Read one layer at a time
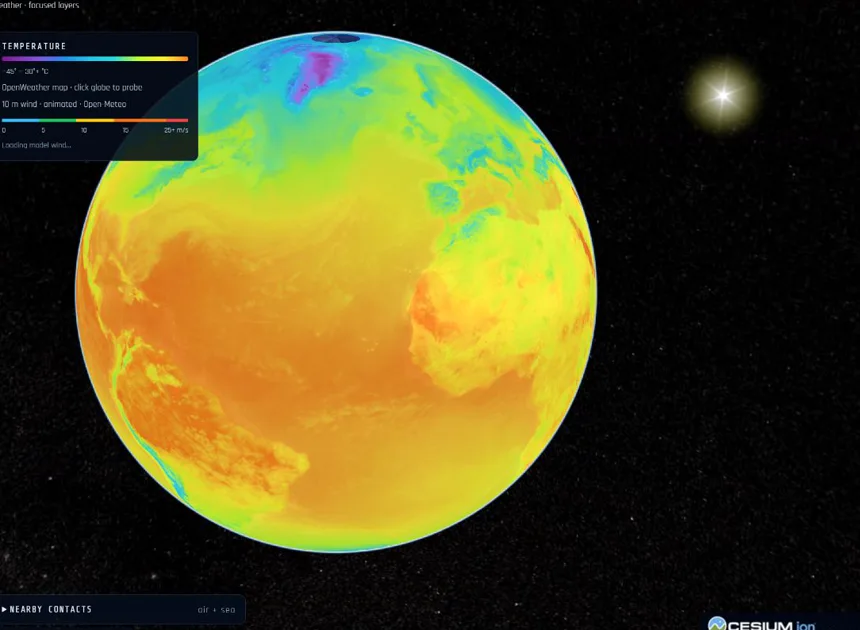
Start with temperature to understand a broad pattern, then switch to precipitation or wind. Use the displayed colour legend rather than judging a colour by intuition. A warm-looking colour on one product may represent a different quantity on another.
Wind animation makes direction and intensity easier to read, but each moving line is a visualization of a weather field. It is not an individual tracked parcel of air. Weather products are updated on their own schedules; check the source and time shown in the interface.
A weather comparison you can try
- Choose a city and note the units and timestamp.
- Compare it with a second city at a similar latitude, one coastal and one inland.
- Switch layers and ask whether the temperature difference also appears in wind or precipitation.
- Repeat on another day. Separate a changing weather observation from a claim about long-term climate.
Keep the evidence in view
Argus combines provider maps with point information and contextual Earth layers. Map shading and a city’s reported condition may describe different spatial scales or times. When they appear to disagree, check those details before assuming one is wrong.
Use Focus on a phone to make room for the globe. Keep only relevant layers enabled, then add aircraft, earthquakes or reporting when that context helps. For official warnings or decisions about hazardous conditions, consult the responsible local weather service.
Read the sources
Scientific sources provide context. Argus is an independent project; a source link does not imply endorsement.