Build a view around a place
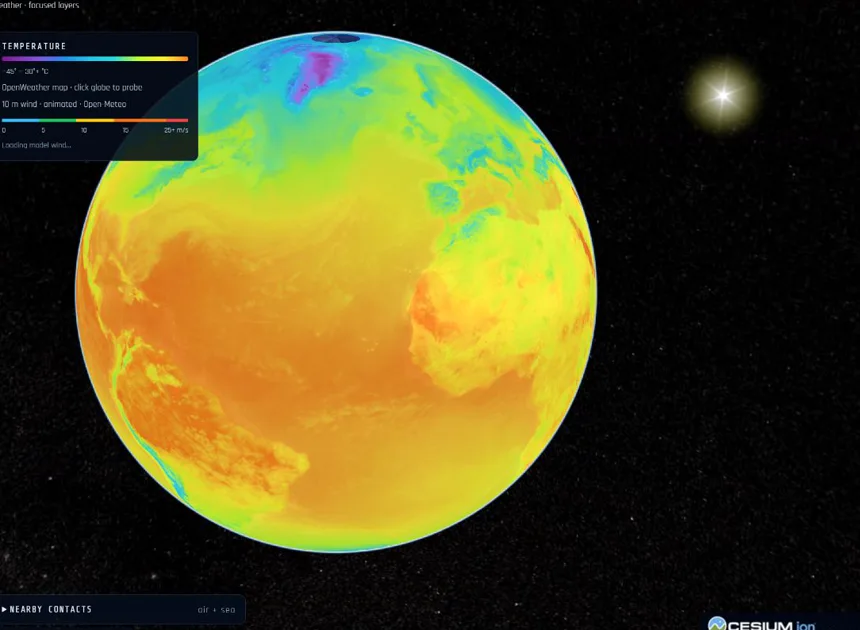
Start with a city or region, then enable only the layers that answer your question. Airspace helps you inspect received aircraft reports; maritime tools show received vessel positions. Weather adds wind, temperature or precipitation, while satellite tools show calculated orbits.
Argus also brings together earthquake reports, public news, road traffic, city cameras and 3D city views where providers supply coverage. These products do not all observe the world at the same moment. The source, timestamp and coverage matter as much as the marker.
Try a short investigation
- Choose a place and establish its geography before enabling extra layers.
- Turn on one live layer and select an object or observation to read its details.
- Check Data health and the report age before interpreting a gap or a stationary marker.
- Add weather or other context, then share the view using the map’s Share control.
Understand what replay shows
History and replay work with observations available to Argus. Choosing a three-hour window does not create a three-hour track when only a few minutes of reports exist. Aircraft and vessel coverage depends on receiver networks, providers and collection history. Satellite positions can be calculated from orbital data, which is different from receiving a live position report.
For a responsive mobile view, keep the layer list short and use Focus to give the globe more room. The Earth guide explains the controls and what the data can support.
Before you begin
Is this an operational navigation system?
No. Argus is an exploration and information tool. Coverage, latency and data quality vary; it is not a substitute for official navigation or safety information.